Attention meets Power Spectrum
Appendix C
In Section 5.1 of our article we show that there is a strong correlation between our attention features and certain features derived from power spectrum of the audio sample (we will call them "spectral features") that are commonly used in speech analysis. Here we present the full results for Pearson Correlation coefficient between Spectral features and all 6 of our attention features (see paragraph Features in Section 2 of the paper), namely:
- (Average element of the) Trace of the attention matrix
- Asymmetry measure of the attention matrix (average of the elements above main diagonal)
- (Average) Attention to the next element
- (Average) Attention to the previous element
- Hm, sym0 (Hm0 for the graph with adjacency matrix A′ = 1 − max (Aattn, ATattn ), that is, the symmetrization of the attention matrix Aattn)
- Hm, pc0 (Hm0 for the rows of the attention matrix considered as a point cloud with the L1-distance.)
Average element of the trace of the attention matrix 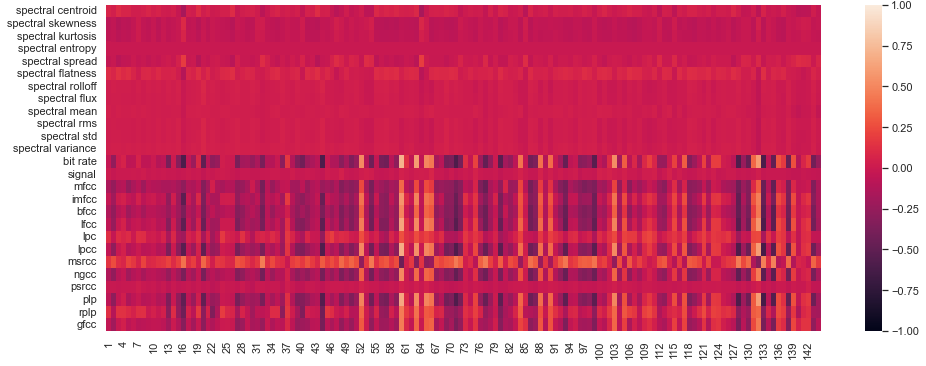
|
Asymmetry measure of the attention matrix 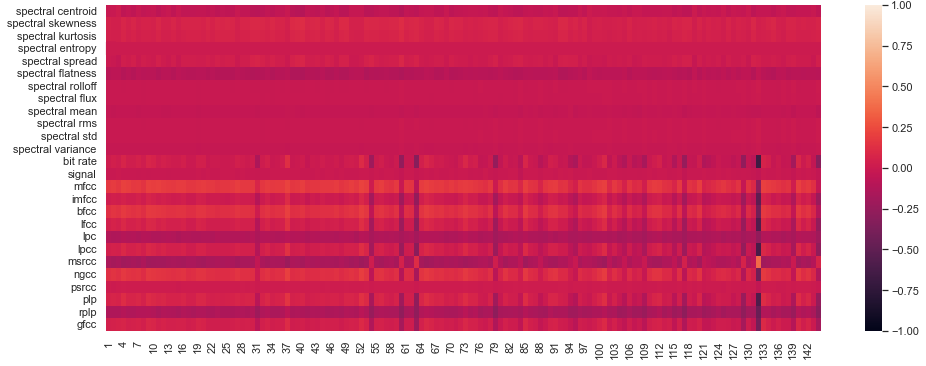
|
Average attention to the next element 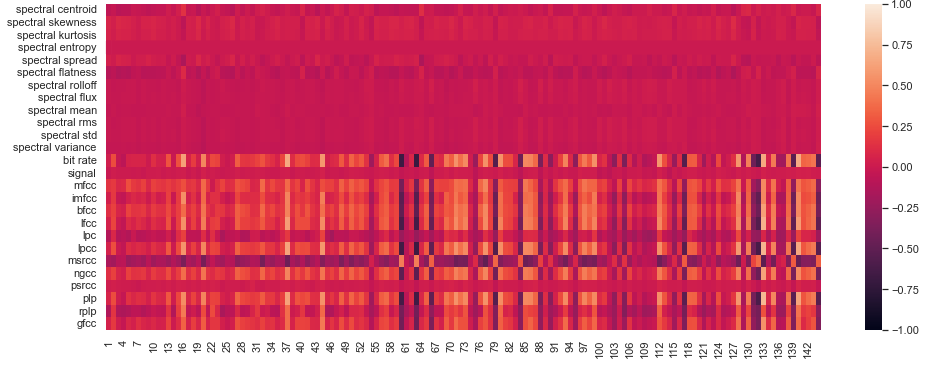
|
Average attention to the previous element 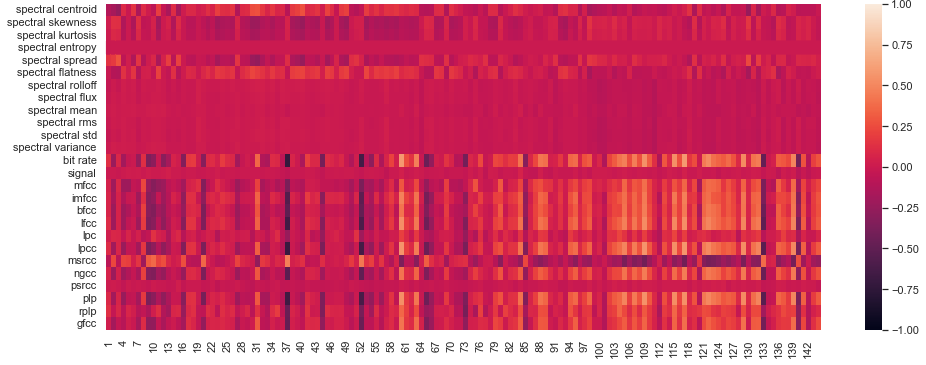
|
Hm, sym0 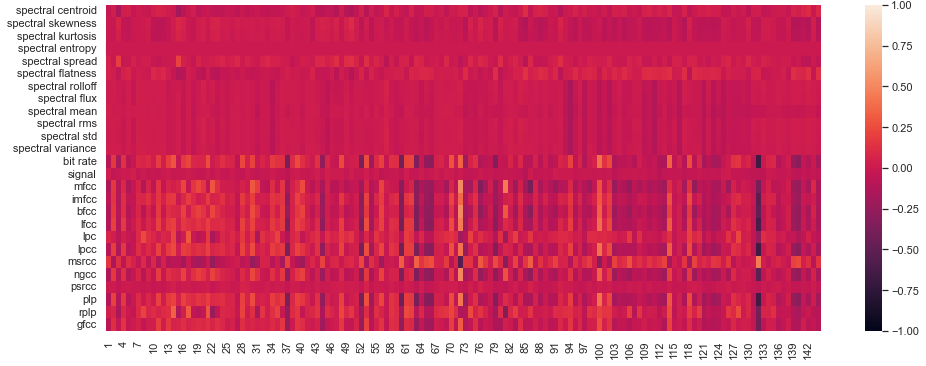
|
Hm, pc0 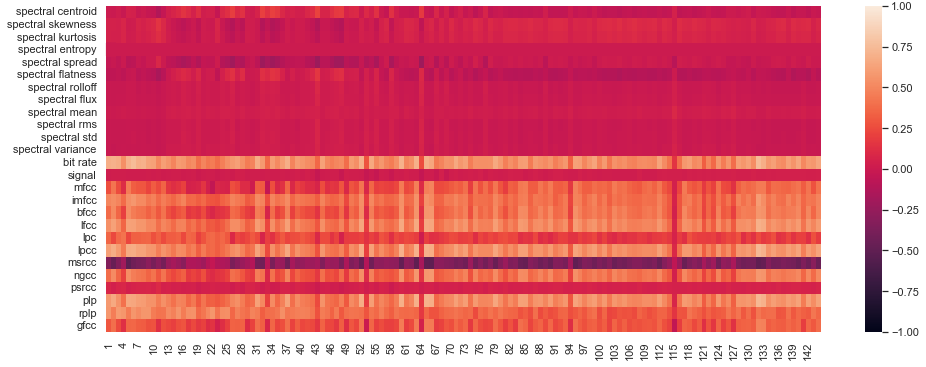
|